How to write IELTS writing task 1 line graph effectively?
Mastering the various charts in IELTS Writing Task 1 is essential for achieving a high band score. Among these, the IELTS writing task 1 line graph is one of the most common and significant formats. This comprehensive guide by IELTS-Testpro will walk you through the definition, structure, and step-by-step strategies to tackle this task with confidence.
I. Introduction to IELTS Writing Task 1 Line Graph
A line graph, also known as Line chart, is a type of graph consisting of one or more lines, each of which shows the alterations over a period of time (weeks, months, years, decades, etc.).
There will be an x-axis (horizontal axis) and y-axis (vertical axis) in an IELTS Writing Task 1 Line Graph. To be specific, the x-axis often represents the time period while the y-axis gives information on what is measured. IELTS Line Graph, therefore, aims to highlight trends (peaks and troughs) among the data collected.
IELTS test-takers, on this task, need to produce a more-than-150-word essay to describe the Line graph without any personal points of view within around 20 minutes. As a consequence, a wide range of knowledge as well as vocabulary and strategies will definitely decide whether you can conquer Line Graph IELTS Task 1 questions or not.
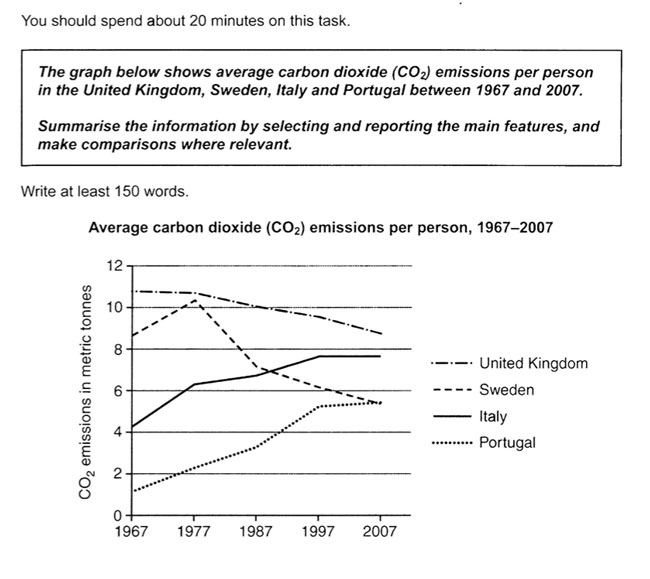
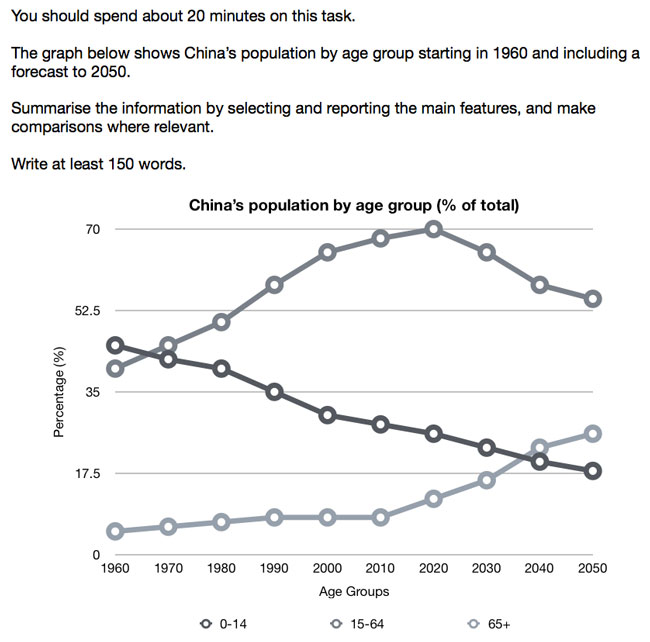
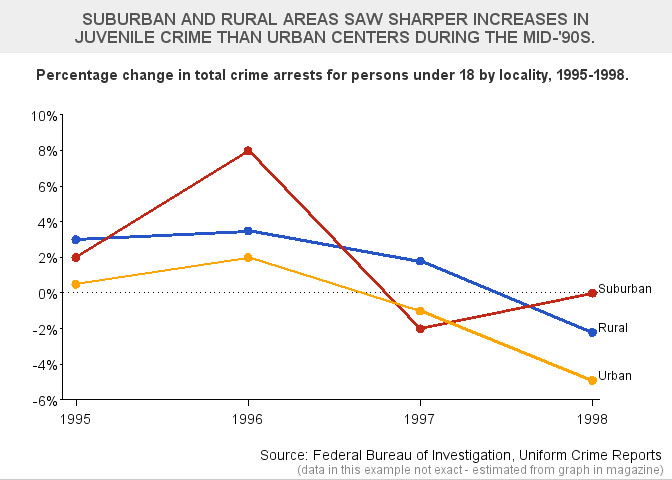
Here are some Line Graph IELTS images:
In terms of structure and steps to write an IELTS Writing Task 1 Line graph essay will be discussed in the next parts.
II. Structure of IELTS Writing Task 1 Line Graph
Normally, there will be four different parts in an IELTS Writing Task 1 Line Graph essay:
1. Introduction
When first starting your IELTS Line graph essay, you need to write the Introduction in which these features should be mentioned:
- Main topic (e.g. the ratio of audiences entertaining radio and television)
- Place (e.g. the UK)
- Time (e.g. December 1992)
- Unit of measurement (% of people)
The Introduction part should be written in your own language by using synonyms, paraphrases, and different expressions without changing the meaning of the Line Graph question.
e.g. The line graph illustrates the proportion of people in the UK who watched TV and listened to the radio over 24 hours from October to December 1992.
2. Overview
Within around two sentences, you need to point out the general trend and special features in the IELTS Line Graph (the highest / lowest point, equal figures, etc.). However, no specific data will be touched upon in this part.
e.g. Overall, a significantly greater percentage of the TV audience watched in the evening while radio had the most listeners in the morning. Over the course of each day and night, more people watched TV than listened to the radio.
3. Body
The Body part in IELTS Line Graph is also the same with other question types in IELTS Writing Task 1.
As usual, it is suggested that the body should be divided into two paragraphs. The first body paragraph can illustrate the figures having the same trend (increasing or decreasing) and the other will be the opposite (e.g. paragraph 1 – decreasing trend; paragraph 2 – increasing trend). The other way to divide the body is to base on the categories such as countries, genders, etc. In addition, you can split up the body according to the period of time (e.g. paragraph 1 – changes from 1995-2000; paragraph 2 – changes from 2000-2005)
Remember to describe figures in detail in this part, and each paragraph should include 3 to 4 sentences.
>>> Read more: IELTS Writing Task 1 Pie Chart.
III. Steps to effectively write an IELTS Writing Task 1 Line Graph essay
To maximize efficiency during the exam, follow this systematic approach.
1. Step 1: Analyse the Line Graph IELTS Task 1 question
In the question given, there will have:
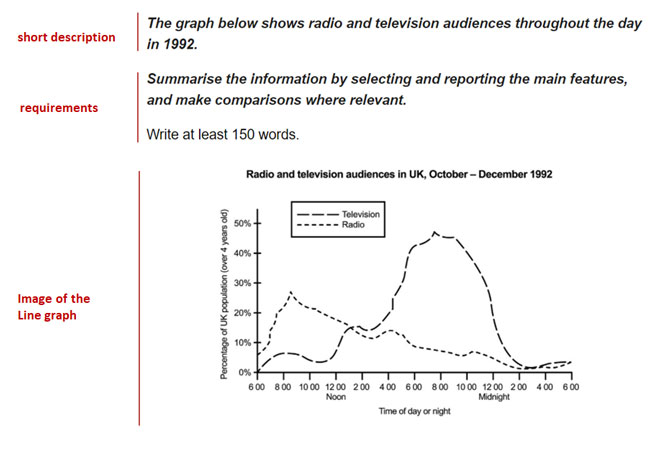
- A short description of the Line graph (e.g. The graph below shows radio and television audiences throughout the day in 1992.)
- Requirements:
Summarise the information by selecting and reporting the main features, and make comparisons where relevant.
& Write at least 150 words. - The image of the Line Chart
It is highly recommended to highlight or underline key words in the Line graph question so that you can keep track more easily while writing.
2. Step 2: Spot main features of the Line graph
To help you with this step, these questions can be taken into consideration:
- What information do both x-axis and y-axis give?
- What is the time period?
- What is the general trend?
- What are the most noticeable features?
- Are there any similarities among categories?
- How to group the data? (for Body part)
Answering all the questions above will firmly give you a more specific view onto the Line graph essay.
3. Step 3: Write your IELTS Writing Task 1 Line Graph essay
It’s time to start off your writing. Remember to follow the structure:
- Paragraph 1: Introduction
- Paragraph 2: Overview
- Paragraph 3: 1st detailed features
- Paragraph 4: 2nd detailed features
4. Step 4: Double Check your IELTS Writing Task 1 Line Graph essay
Make sure your essay does not have any grammatical or spelling mistakes. Besides, using various structures will boost your final score.
IV. Tips for IELTS Writing Task 1 Line Graph
To further polish your skills, consider these expert tips specifically for line graphs.

- Use two different paragraphs for the Body
Try to divide the body part into 2 paragraphs because this can enhance the organisation of the report and make it easier to read.
- Compare the lines
Avoiding describing each line separately but comparing those in most of your sentences will gain you a better score.
- Don’t try to describe all the elements
Just focus on key and outstanding figures only since the time allowed is limited so you don’t have to list every detail in the Line graph.
- Start the report with the first year and finish with the last year
First of all, look at the x-axis and report the first year’s figures and compare lines in that year. Then finishing the report the last year given.
- Don’t express your feeling or perspective
IELTS Writing Task 1 Line Graph, and all other types of questions in IELTS Writing Task 1, will be a report of data and numbers, so don’t give any personal point of view in your essay.
- Use appropriate vocabulary and structures
IELTS Line Graph vocabulary and various grammar structures should be used properly. You can refer to this article ielts academic writing task 1 to learn more about vocabulary for IELTS Writing Task 1 Line Graph.
- Watch out the time and word limit
You should spend approximately 20 minutes for IELTS Writing Task 1 with at least 150 words, so make sure your essay will be eligible.
To dominate IELTS Writing Task 1 Line Graph, having a grasp of knowledge is not enough but you need to consult diverse samples and practice as much as you can. To do so, IELTS TEST PRO with both mobile app and website platforms can facilitate you with multiple model samples and practice tests to write under time pressure. Download IELTS TEST PRO mobile app or visit our website now!