How to write a high-scoring IELTS writing task 1 pie chart?
1. An overview of IELTS Writing Task 1 Pie Chart
In IELTS Academic Writing Task 1, if you spot one or some colorful circular charts with different divided parts within, also regarded as pie slices. In each pie sector, there is a ratio illustrating what percentage of the data represented. Then, a full circle with exactly 100% will be made from all pie slices or pie sectors. Beside a complete pie chart, several annotations will be used to clarify the sectors with different colors or symbols.
IELTS Pie chart offers the best way to visually display data so that candidates can discern the size of components within the whole, especially when proportions or percentages are shown. Normally, data on specific fields of diverse regions or within a country at divergent points of time or a fixed time will be illustrated in this chart type in order to indicate the comparison among categories.
On this IELTS Pie Chart task, you are required to report significant figures in a time limit around 20 minutes with more than 150 words. Try to use a wide range but appropriate vocabulary and grammar structures in IELTS Writing Task 1 Pie Chart.
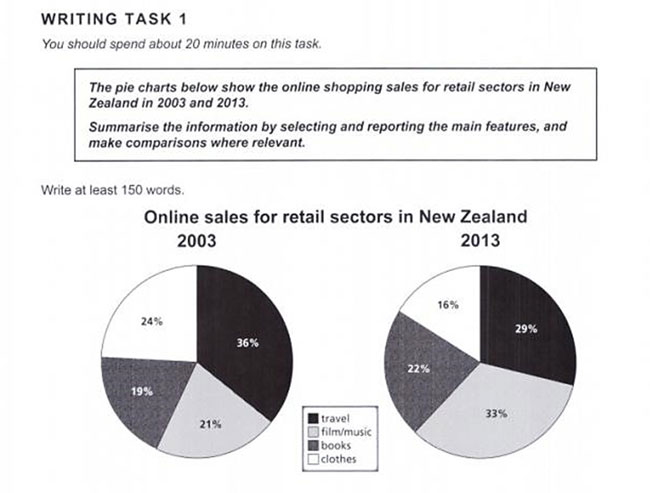
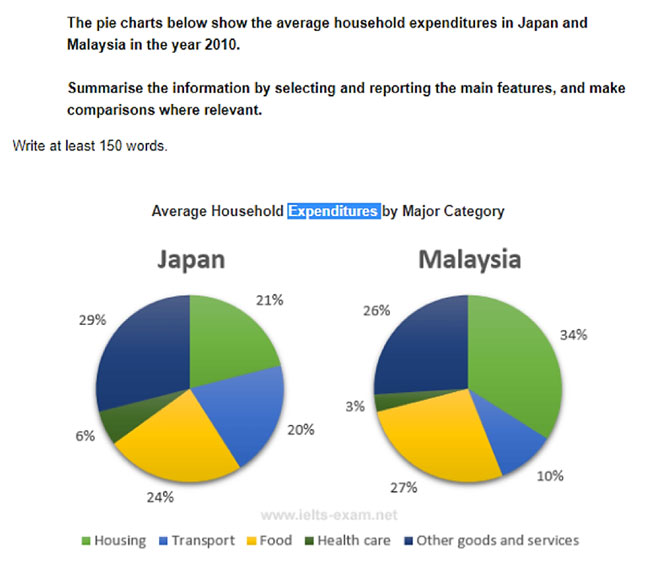
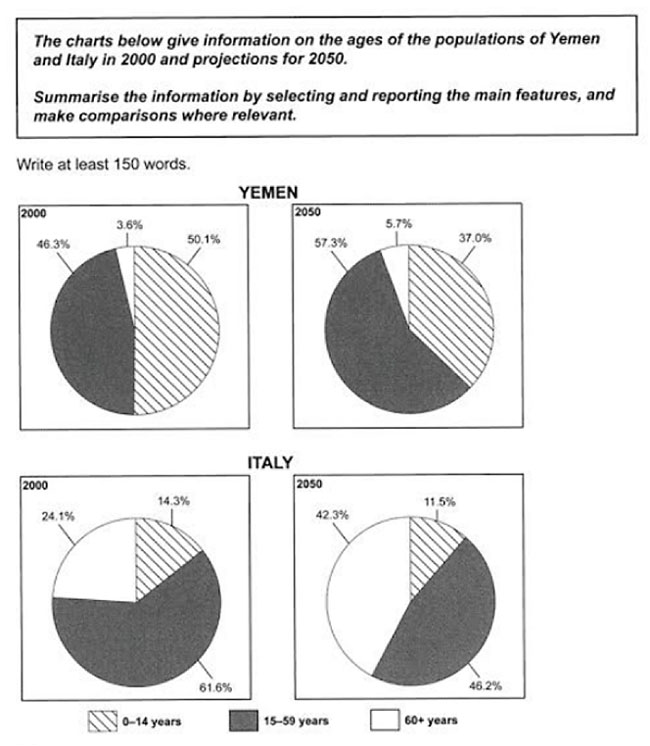
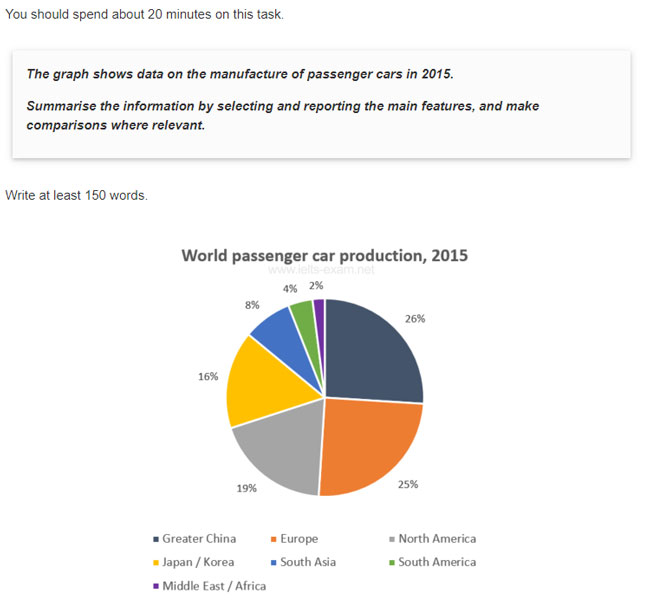
Here are some IELTS Writing Task 1 Pie Chart samples:
2. Structure of IELTS Writing Task 1 Pie Chart
On the whole, IELTS Pie Chart in Writing Task 1 will be divided into three parts:
2.1. Introduction
The very first part in your IELTS Pie Chart report is the Introduction in which the question should be paraphrased in one or two sentences only. Take these key features into account:
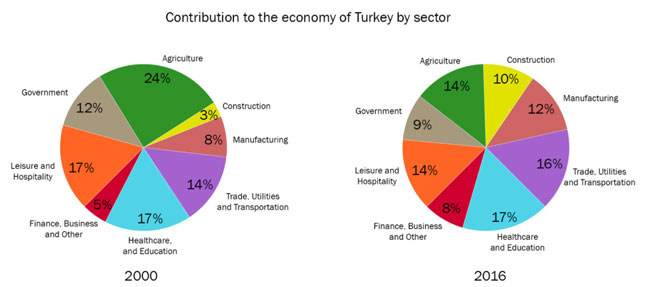
- Main topic (e.g. industry sectors’ contribution to the economy)
- Place (e.g. Turkey
- Time (e.g. 2000 & 2016)
- Unit of measurement (%)
e.g. The two pie charts illustrate how different industry sectors contributed to the economy of Turkey percentage wise in the years 2000 and 2016.
Practice now: IELTS Writing Practice Test
2.2. Overview
Without mentioning any specific figure, the Overview part should contain only the general trend and outstanding features such as:
- The biggest pie slices
- The smallest pie slices
- The same-sized pie slices
- The unchanged pie slices
- The isolated pie slices (if any)
- etc.
e.g. Overall, at the beginning of the period construction contributed the least to the economy of Turkey and agriculture was the most significant economic sector. In comparison, at the end of the period healthcare and education became the largest economic segment and the lowest contribution was made by financial, business and other services.
2.3. Body
In the Body part, specific details will be reported in two separate paragraphs. You can group the data of the Pie Charts base on such ways:
- Dynamic chart (overtime changes):
– Time (e.g. paragraph 1: figures in 2000; paragraph 2: figures in 2016)
– Categories (e.g. paragraph 1: biggest and smallest slices of each pie chart; paragraph 2: others categories)
- Static chart (changes at a certain point of time):
– Each pie chart (e.g. paragraph 1: pie chart 1; paragraph 2: pie chart 2 + comparison with pie chart 1)
– Differences and Similarities (e.g. paragraph 1: the biggest and smallest slices in all pie charts; paragraph 2: other categories which are different in amount)
Each paragraph in the Body part of IELTS Pie chart should only consist of three or four sentences with detailed key features.
>>> Read more: IELTS Writing Task 1 Table
3. Steps to write a high-scoring IELTS Writing Task 1 Pie Chart report
3.1. Step 1: Analyse the IELTS Pie Chart question
IELTS Writing Task 1 Pie Chart will contain:
- Description of the chart
(e.g. The two pie charts below show the percentages of industry sectors’ contribution to the economy of Turkey in 2000 and 2016.)
- Requirements:
Summarise the information by selecting and reporting the main features, and make comparisons where relevant.
& Write at least 150 words.
- Chart:
You should underline or highlight important parts in the questions so as to maximise your score.
3.2. Step 2: Point out main features
To identify key characteristics of the pie chart, you should find the answer for each question below:
- What are the periods of time?
- What is the unit of measurement?
- What do the title and labels represent?
- What is the general trend?
- What are the biggest, smallest pie slices?
- Are there any obvious similarities?
- Are there any special categories?
3.3. Step 3: Start to write the IELTS Writing Task 1 Pie Chart
Try to follow the three-part structure of the IELTS Pie Chart essay with four paragraphs:
- Paragraph 1: Introduction
- Paragraph 2: Overview
- Paragraph 3: 1st detailed features
- Paragraph 4: 2nd detailed features
Now, in order to be much more confident and ready before the coming IELTS test, let’s check out our comprehensive IELTS online test
3.4. Step 4: Check your IELTS Writing Task 1 Pie Chart essay
You may make several mistakes while reporting the IELTS Pie chart in terms of grammatical structures, spellings and word choices in your essay. Therefore, rechecking what you have written is a must for the final step.
4. Tips for IELTS Writing Task 1 Pie Chart

4.1. Meet the requirements of the IELTS Pie chart question
Normally, IELTS Writing Task 1 asks you to give the information on main features (not all features), and make comparisons among categories, which means you had better not report figures separately.
4.2. Make use of connective words
In the IELTS Writing Task 1 Pie chart, the way you use connective words flexibly (In general, Overall, Next, Besides, In contrast, compared to, On the other hand, etc.) will be such an advantage to boost your score since it can improve the cohesion of sentences and paragraphs.
4.3. Use a wide vocabulary range and diverse grammatical structures
You should use proper words used for IELTS Writing Task 1 in general and IELTS Pie Chart in specific. Besides, try to use synonyms, paraphrases, expressions, and manifold grammatical structures to describe the pie chart. This article below will give you vocabulary for IELTS academic Writing Task 1, so let’s check it out!
4.4. Don’t give personal opinions
You will definitely get minus points when using words or expressions showing your point of view because IELTS Writing Task 1 Pie Chart is an analytic report.
IELTS Writing Task 1 Pie Chart will no longer be a barrier for you when assimilating enough knowledge and practice frequently. Also, consulting model sample answers from others’ can help you more with writing a high-scoring IELTS Pie chart essay. IELTS TEST PRO can facilitate you with those features, so download the app or visit our website and practice with us now!