IELTS Writing task 1 mixed charts: Overview, steps & tips
1. An overview of IELTS Writing Task 1 Mixed Charts
At first glance, Mixed Charts seem to trigger difficulties due to its complexity. In fact, this chart type comprises frequently-used charts in IELTS Writing Task 1 such as line graph, bart chart, pie chart, table, etc. As a result, you just need to analyse data and figures in the same way as you do with a separate graph. The most crucial point while doing an IELTS Mixed Chart report is to compare and draw conclusions about the correlation between the two graphs.
You will be given a line graph and a bar chart, or a pie chart with a table, or any other combination in IELTS Writing Task 1 Mixed Charts. All you need to do is to clarify, make comparisons and give detailed information on all main features of each graph. 20 minutes will be the ideal time for you to complete this task with no less than 150 words.
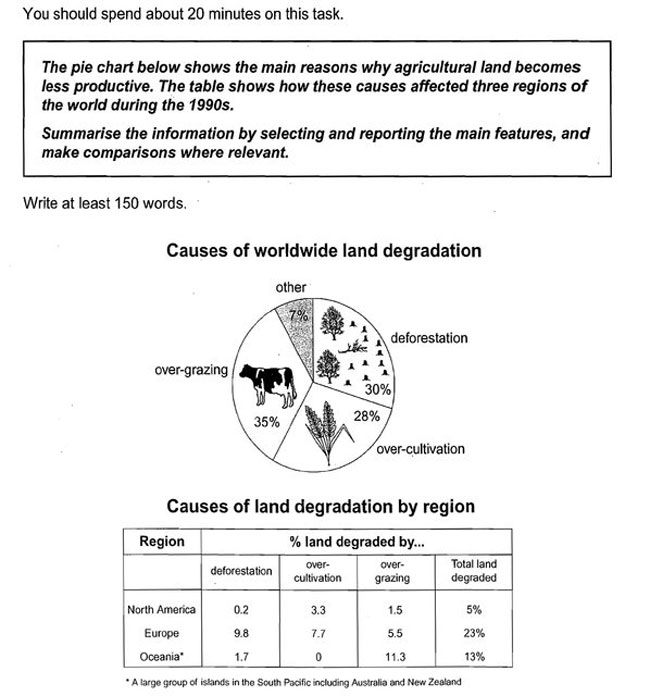
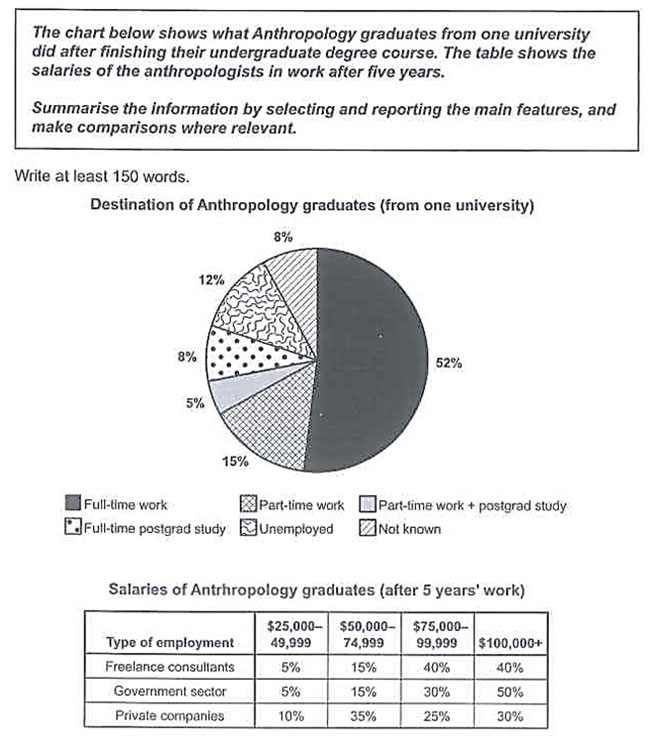
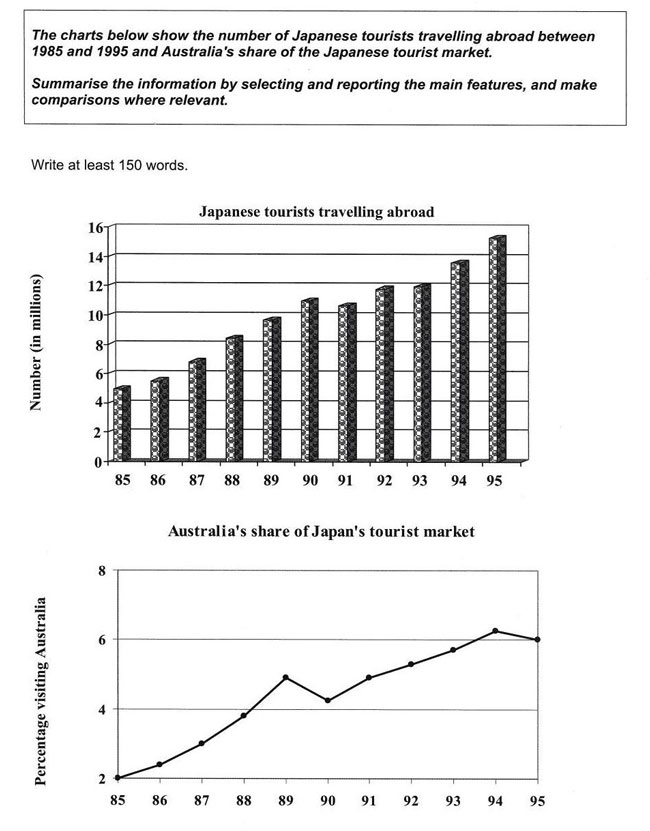
Here are several samples for IELTS Writing Task 1 Mixed Charts:
2. Structure of IELTS Writing Task 1 Mixed Charts
IELTS Mixed Charts, as other types of question in IELTS Writing Task 1, follow the three-part structure:
2.1. Introduction
You should first start your IELTS Writing Task 1 Mixed Charts with one to two sentences paraphrasing the question in your own language. These key features are indispensable:
- Types of charts (bar chart and pie chart)
- Time period (no time period)
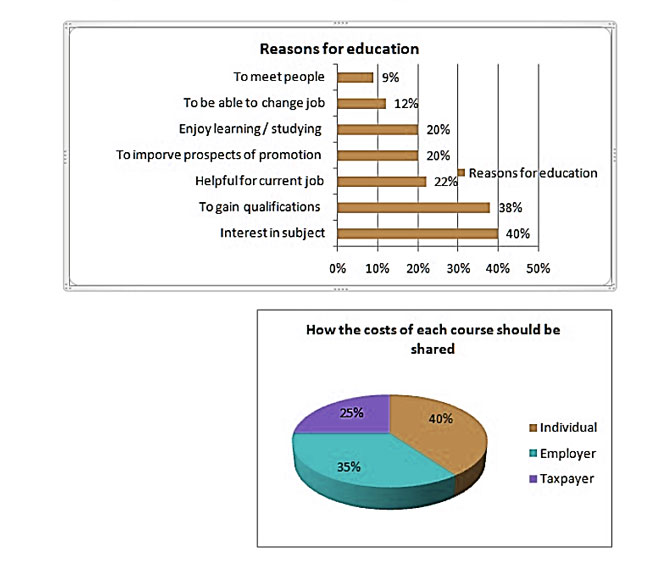
- Main topic of each chart (bar chart: the reasons why adults decide to study; pie chart: how people think the costs of adult education should be shared)
e.g. The given bar chart illustrates an opinion survey about the factors as to why people choose to go to school while the pie graph portrays how adults consider the costs of academic should be funded.
You should use “while” or “and” to combine the two sentences.
➡️➡️ See more: IELTS Writing Practice Test
2.2. Overview
You can simply write this part in two to three sentences with outstanding features in each graph. To be specific, the first sentence will be the main features from the first graph, the second sentence will be the main features from the second graph. Also, any comparisons can be optionally mentioned in sentence 3.
For key features, you can base on these suggestions to sort out:
- The general trend overtime
- The highest/lowest figures
- The gaps among figures
e.g. Overall, it is apparent in the bar chart that there are seven reasons as to why adults decide to study, and the subject of interest is the most significant one. On the other hand, it can be observed from the pie chart that individual funding for education has had a far higher percentage compared to the other two.
2.3. Body
The body will be ideally divided into two different paragraphs.
It is advisable to separate the Body part in this following way:
- Paragraph 1: Details of the two main features from graph 1
- Paragraph 2: Details of the two main features from graph 2 + details of any special features or comparisons (if any)
3. Steps to write an effective IELTS Writing Task 1 Mixed Charts report
3.1. Step 1: Analyse the question
Underline or highlight these features as you read the question:
- An overview of the chart
(e.g. The charts below show the result of a survey of adult education. The first chart shows the reason why adults decide to study. The pie chart shows how people think the costs of adult education should be shared.)
- Chart types:
bar chart, line chart, table, pie chart, etc.
- Requirements: Summarise the information by selecting and reporting the main features, and make comparisons where relevant.
Don’t pick out all features and figures in both charts since time and the number of words are limited (more than 150 words in around 20 minutes), so try to report key features only and make comparisons.
- Charts:
3.2. Step 2: Identify main features of both graphs
Depending on which types of graph you are dealing with, you need to figure out these features in each:
- What information does each graph give?
- What is the period of time (if any)?
- What are the most outstanding features in each graph?
- Are there any similarities among categories in each graph?
- What is the relation between two graphs?
Once you surely get these details from each graph, you are ready for writing an IELTS Writing Task 1 Mixed Charts essay.
3.3. Step 3: Write the essay
It’s now time to start writing your IELTS Mixed Charts report, but make sure you follow the proper structure:
- Paragraph 1: Introduction
- Paragraph 2: Overview
- Paragraph 3: Detailed features of Graph 1
- Paragraph 4: Detailed features of Graph 2
3.4. Step 4: Re-check your essay
Don’t lose points for incorrect spelling or grammatical errors so make sure you double-check your IELTS Writing Task 1 Mixed Charts before continuing to IELTS Writing Task 2.
>>> Read more: IELTS Writing Task 1 Process
4. Tips for IELTS Writing Task 1 Mixed Charts
- Don’t write too much since your available time for you is just about 20 minutes. Just select outstanding features to report (two features from each graph)
- Don’t group data from different graphs into one paragraph but follow the structure mentioned above (body paragraph 1: graph 1; body paragraph 2: graph 2)
- Make sure that there will be at least a comparison between two graphs
- Do not give personal points of view or you will lower your scores
- Utilise as many linking words as possible among sentences and paragraphs to highlight the coherence
- Use proper vocabulary and grammar structures for each graph. You can refer to specific types of graphs in our blogs on IELTS TEST PRO website.
IELTS Writing Task 1 Mixed Charts may appear as a complex question type at first because there is much data listed in two charts. However, the approach and solution for each graph is quite similar to the way to handle the one-chart question types. With all the information, structure, steps and tips mentioned above, you can get a high score in writing a IELTS Writing Task 1 Mixed Charts report.
Visit IELTS TEST PRO website or mobile app now to access more useful knowledge of the IELTS exam.