The Ultimate Guide to Master IELTS Academic Writing Task 1
Struggling to interpret complex graphs or manage your time effectively? IELTS Academic Writing Task 1 is often seen as a major hurdle, requiring both English proficiency and precise data analysis skills. This comprehensive guide, powered by expert insights from IELTS-TestPro, is designed to help you overcome these challenges—whether you are aiming for a Band 7.0+ or just starting out—by breaking down the 7 specific question types, essential vocabulary, and structural strategies needed to succeed in your upcoming exam.
I. Overview IELTS Academic Writing Task 1
Before diving into complex charts and data analysis, it is essential to grasp the fundamental requirements of the task. Understanding the structure, timing, and assessment criteria lays the groundwork for a high-scoring performance.
1. Structure
In the IELTS Academic Writing module, Task 1 requires candidates to describe visual information accurately. At IELTS-TestPro, we strongly suggest allocating no more than 20 minutes to complete this task, ensuring you write a minimum of 150 words. Although it accounts for only one-third of your total Writing score, performing well here is crucial for a high overall band.

A high-scoring response typically follows this four-part structure:
- Introduction: Paraphrase the question prompt using your own vocabulary to define what the graph shows.
- Overview: Identify and state the main trends or the most significant features without looking at specific data points. This is the most critical paragraph for scoring Band 6.0+.
- Body Paragraph 1: Report detailed features supported by specific data and make relevant comparisons.
- Body Paragraph 2: Continue reporting the remaining details with specific figures and comparisons.
Ready to test your skills? Let’s get started with our free IELTS online test on IELTS-TestPro to gauge your current level.
2. Types of Questions
In general, there are 7 types of questions asked in IELTS Academic Writing Task 1 namely:
- Line graph
- Bar chart
- Pie chart
- Table
- Mixed charts
- Map
- Cycle – Process
3. Scoring and Assessment
To achieve your target band score, you must satisfy the four criteria set by the official IELTS descriptors:
- These are some criteria description that you should pay attention to when doing IELTS Academic Writing Task 1:
| Task achievement | – word count
– key features – structure (form of a letter, report) |
| Coherence and cohesion | – organisation of ideas or information
– linking devices – paraphrasing |
| Lexical resource | – appropriate language
– flexible vocabulary usage – collocations – spelling errors |
| Grammatical range and accuracy | – grammar structures
– tenses – punctuation |
- The picture below issued by the British Council, IDP: IELTS Australia and Cambridge English Language Assessment is the specific band descriptor for the IELTS Writing Task 1
II. Types of questions in Ielts Academic Writing Task 1
The IELTS exam presents data in various visual formats, each requiring a specific approach and vocabulary set. Below is a detailed breakdown of the seven types you might encounter to help you identify and tackle them with confidence.
1. Line Graph
The line chart or line graph in IELTS Academic Writing Task 1 is formed by two axes Ox and Oy (vertical and horizontal), in which lines illustrate the trend of the figures. Those figures are usually attached to a period of time or a certain point of time.
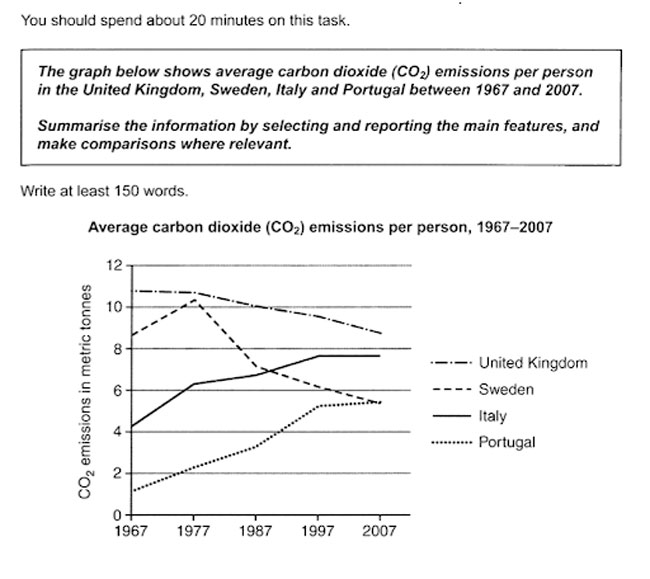
Picture 1. Line graph
2. Bar Chart
The bar chart or bar graph in IELTS Academic Writing Task 1 including vertical and horizontal axes indicates a trend over a time period or in a year.
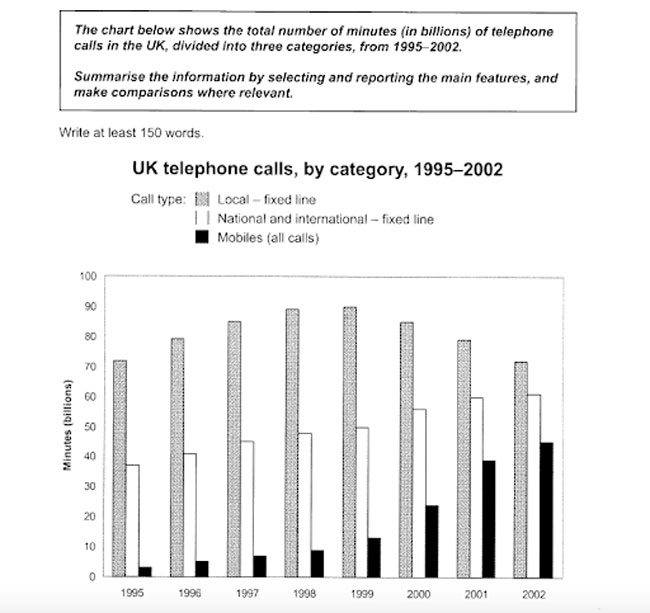
Picture 2. Bar chart
3. Pie Chart
The pie chart in IELTS Academic Writing Task 1 normally exhibits the percentage of different categories. The test-takers need to report at least 2 to 3 pie charts to show how data has changed over time or how categories are different in countries, regions, etc.

Picture 3. Pie chart
4. Table
Tables in IELTS Academic Writing Task 1 are more preferred due to the ease of reading the clearly-listed data. Nonetheless, candidates have to figure out the trend from the data based on numbers or percentages.
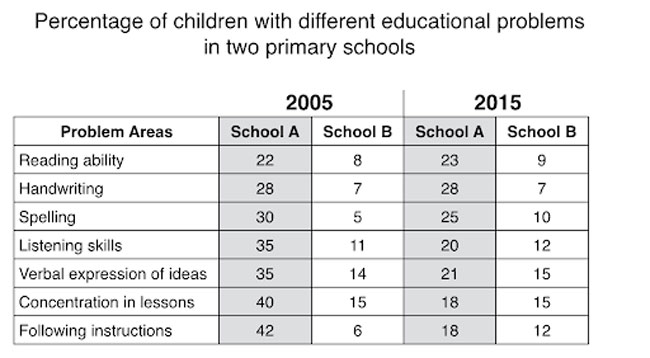
Picture 4. Table
5. Mixed Charts
The mixed charts in IELTS Academic Writing Task 1 are actually the combination of 2 in 4 chart types mentioned above. The second chart often shows a more detailed aspect of the former, hence it is essential to present the relationship between the two graphs.
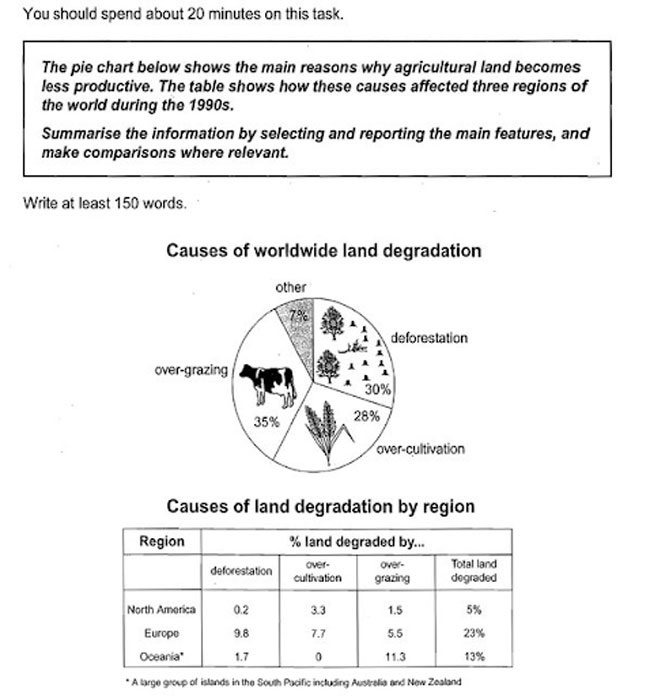
Picture 5. Mixed charts
>>> Read more: IELTS General Writing Task 1
6. Map
Map in IELTS Academic Writing Tasks 1 is represented in the form of an image in which the over-time changes of a location are required to describe in detail.
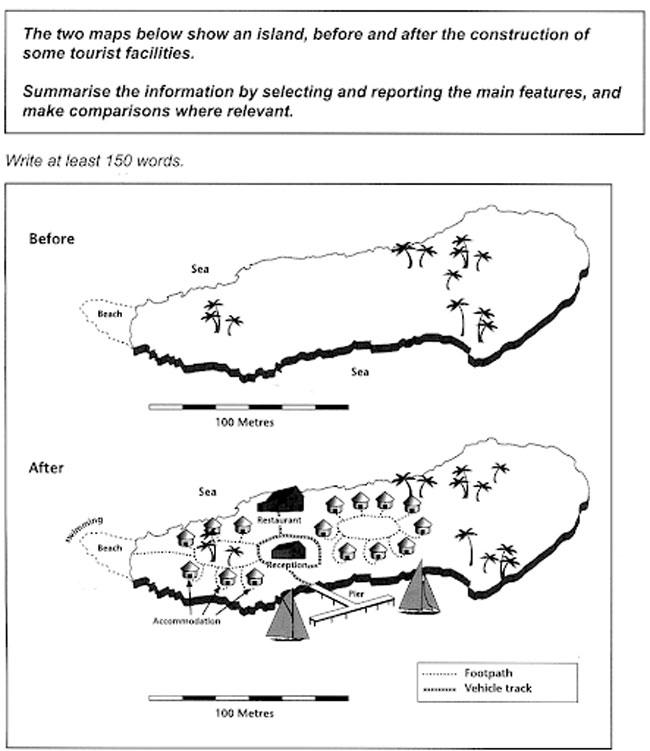
Picture 6. Map
7. Cycle – Process
Cycle – Process in IELTS Writing Task 1 shows a process (growth, production, mechanism, etc.) of a creature, product, system, etc. Candidates need to connect the elements in a sequence to form a complete task.
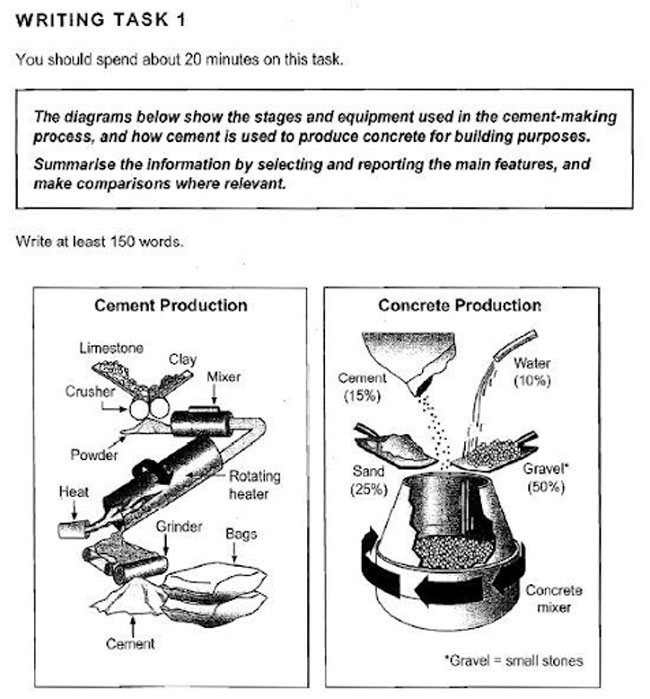
Picture 7. Cycle – Process
III. How to write Ielts Academic Writing Task 1?
Achieving a high score requires more than just describing what you see; it demands a systematic approach. By following this proven step-by-step method, you can ensure your report is both accurate and well-structured within the time limit.
1. Introduction
IELTS Academic Writing Task 1 should start with paraphrasing the topic question in 1 to 2 sentences.
Some words and phrases should be taken into consideration when paraphrasing the topic question:
- graph / chart / diagram / map / table / process / …
- give(s) / provide(s) information on/about …
- show(s) / illustrate(s) / exhibit(s) / represent(s) / depict(s) / describe(s) / explain(s) / compare(s) …

The test-takers need to answer these questions below in order to have a complete introduction:
- What are the types of charts or images given?
- What are the main subjects depicted in the charts or images?
- In what time period is the data located? (if any)
- What is the unit of measurement?
>>> Read more: IELTS Writing Task 2
2. Overview
In about 2-3 sentences, the overview of IELTS Academic Writing Task 1 should consist of two common features:
- Trend: the common trend over the period of time? (increase, decrease, fluctuate)
- The most remarkable features: the highest/smallest figure or the most changing figure
You can refer to several ways to begin the Overview:
- Overall
- In general
- In particular
- From an overall perspective
- Looking at the chart/graph/…, it can be seen that
- It is noticeable that…
- The data indicates that…
3. Body 1 & 2
This is the most pivotal part in IELTS Academic Writing Task 1 since there is no specific structure to follow. Generally, Body will be splitted into 2 parts with 3-4 sentences per paragraph.
Firstly, candidates should group the data due to the similarities and differences in the graph. Then, it is necessary to divide the data into 2 categories corresponding to 2 paragraphs.
(e.g.
Body 1: the highest figures
Body 2: the lowest figures
or
Body 1: the increasing figures
Body 2: the decreasing figures)
It also should be noted that the data in the Body part needs to be described in detail with specific numbers, percentages, etc.
Here are the lists of vocabulary for IELTS Academic Writing Task 1:
- Trends:
| Verbs | Nouns | |
| – General increase:
increase rise grow go up climb – Sudden or large increase: rocket jump leap soar shoot up |
– General increase:
increase rise growth – Sudden or large increase: rocket jump leap soar |
|
| – General decrease:
decrease reduce decline drop fall (down) go down – Sudden or large decrease: plunge plummet dive dip collapse |
– General decrease:
decrease reduction decline drop fall – Sudden or large decrease: plunge plummet dive dip collapse |
|
| fluctuate
vary wave |
fluctuation
variation |
|
| remain stable
stay unchanged stablize level off |
stability | |
| peak
reach a peak (of) reach / hit the highest point |
||
| bottom out
reach / hit the lowest point reach a bottom fall to a low |
- Adjectives & Adverbs:
| Adjectives | Adverbs |
| – Speed:
sharp rapid sudden gradual steady abrupt slow constant – Amount: considerable significant dramatic enormous substantial tremendous noticeable slight gentle moderate |
– Speed:
sharply rapidly suddenly gradually steadily abruptly slowly constantly – Amount: considerably significantly dramatically enormously substantially tremendously noticeably slightly gently moderately |
- Prepositions:
| to | describe how much the change is
(e.g. increase/decline to 100 grams) |
| by | describe an approximate change
(e.g. increase/decline by 30%) |
| of | N + of + figures
(e.g. a drop of 50 kilograms) |
| at | describe a specific figure
(e.g. stand at 80 products) |
| with | describe percentage, quantity
(e.g. with 36%) |
- Comparisons:
| 1. Comparative & Superlative | – Adj-er + than / more + Adj + than
– the + Adj-est / the most + Adj (+ N) |
| 2. Equal Comparison | – similar (to)
– the same (as) – as + Adj + as |
| 3. Linking words | – Whereas / While
– In contrast / On the contrary – compared to/with – On the other hand – However / but – Although – In comparison (to) |
- Percentage:
| – consist of
– comprise – include – account for – take up – make up – contribute – constitute – stand (at) – amount |
|
>>> Practice more: IELTS Writing Practice Test
IV. Common mistakes and tips to get a high band score in Ielts Academic Writing task 1
Even advanced learners can lose valuable marks due to simple, avoidable errors. To secure a Band 7.0 or higher, review these common pitfalls and apply our expert strategies to your practice.

| Common Mistakes | Tips |
| Copy the entire topic | Paraphrase the topic in your own words and style |
| Include specific data in the Overview | Just contain the main features in general terms |
| Try to report everything | Summarise or mention the main features only (general trend, similar/different figures, outstanding figures, etc.) |
| Not compare figures but report separately | Compare the data is required when the figures are related to each other |
| Not organise ideas logically | Try to follow the structure given in the previous section:
|
Other tips to practice the IELTS Academic Writing Task 1 more effectively:
- Take a look at all types of questions in IELTS Academic Writing Task 1 (line graph, bar chart, pie chart, table, mixed charts, map, cycle – process) and prepare a template for each type
- Take the most advantage of model answers or samples written by experts, teachers, or peers with a high band score and look for useful vocabulary, collocations, grammar, and structures so as to apply for your own report
- Utilize 20-minute task effectively with this time stamp:
– 5 mins: Read instructions and graphs & write down the Introduction by paraphrasing the topic question
– 5 mins: Figure out the main features (general trend, remarkable figures, etc.) in an overall perspective & write down the Overview
– 10 mins: Dig in the details of the graphs and try to separate the Body into 2 paragraphs
IELTS Test Pro will provide you manifold up-to-date topics with model answers accompanied by recommended vocabulary & phrases. Also, several tips included can help you with your Writing practice Ielts progress. Install and experience our app now!