100+ IELTS Line Graph Vocabulary Words & Phrases to Describe Trends Accurately
Line graphs appear frequently in IELTS Writing Task 1, and knowing how to describe them is essential. This guide provides 100+ IELTS line graph vocabulary words and time expressions to help you describe trends with precision and boost your band score.
What is IELTS Line Graph Vocabulary?
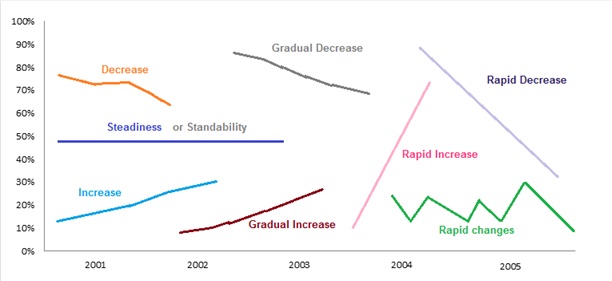
Line graphs are one of the most common visuals in IELTS Writing Task 1. They typically show how data changes over time across months, years, or decades. In a line graph, your goal is to describe:
- Trends: upward, downward, or fluctuating
- Magnitude: sharp, gradual, slight changes
- Time references: from 2005 to 2010, between January and April
- Comparisons: while A rose, B fell
To score Band 7 or higher in IELTS Writing, vocabulary plays a key role. A strong command of IELTS line graph vocabulary will boost your Lexical Resource score—a key grading criterion accounting for 25% of your overall mark. Precise vocabulary helps you avoid repetition, show variety, and demonstrate control over academic language.
Vocabulary for Upward Trends
These words describe increases in data:
- Rise
- Grow
- Climb
- Increase
- Surge
- Soar
- Rocket
- Expand
- Escalate
- Shoot up
- Jump
- Advance
- Peak
- Reach a high
- Gain
- Climb steadily
- Experience an upward trend
- Register an increase
- Show growth
- See a rise
Example:
“The number of car sales surged dramatically in the first quarter.”
“Internet usage among teenagers climbed steadily from 2005 to 2015, reaching nearly 90% by the end of the period.”
“The percentage of renewable energy used in households experienced an upward trend, doubling within a decade.”
Vocabulary for Downward Trends
Use these to show decreases in data:
- Decrease
- Drop
- Fall
- Decline
- Plummet
- Collapse
- Dip
- Diminish
- Shrink
- Slide
- Tumble
- Sink
- Go down
- Take a downturn
- Experience a decrease
- Show a downward trend
- Register a fall
- Hit a low
- Reach a trough
- See a decline
Example:
“Employment rates plummeted in 2008 due to the financial crisis.”
“The average housing prices declined steadily after 2010 due to decreased buyer demand.”
“Smartphone sales dipped slightly in Q3 before rebounding at the end of the year.”
Vocabulary for Fluctuations
Use these when data goes up and down:
- Fluctuate
- Be volatile
- Vary
- Shift
- Waver
- Zigzag
- Show instability
- Rise and fall
- Be erratic
- Show variation
- Swing
- Go through cycles
- Experience ups and downs
- Undulate
- Be inconsistent
- Be unpredictable
- Hover
- Be uneven
- Change frequently
- Display irregular patterns
Example:
“The cost of oil fluctuated throughout the year due to global demand shifts.”
“Electricity consumption varied considerably throughout the winter months.”
“The stock market index went through cycles of rise and fall during the fiscal year.”
Vocabulary for Stability or No Change
Use these for stable or flat trends:
- Remain steady/stable
- Remain unchanged
- Stay the same
- Stabilize
- Plateau
- Be flat
- Level out
- Show no change
- Be consistent
- Be constant
- Exhibit stability
- Maintain the same level
- Reach a plateau
- Hold firm
- Remain static
- Continue at the same rate
- Stay constant
- Be stable
- Register no movement
- Retain a fixed level
Example:
“The number of visitors remained stable between 2016 and 2018.”
“The unemployment rate remained unchanged from 2012 to 2015 despite economic reforms.”
“The production volume of factory A held firm at around 10,000 units for three consecutive years.”
Time Phrases to Use in Line Graphs
These time references help organize your sentences:
- From [year] to [year]
- Between [month] and [month]
- Over the course of [X years]
- During the period shown
- Throughout the [decade/year]
- In the first quarter
- By the end of the year
- At the beginning of the period
- In mid-[year]
- In the final months of the year
- Over the span of [X years]
- Between the first and second half of the year
- After [event/year]
- Before the decline
- After reaching its peak
- In the following years
- By mid-year
- In early/final stages
- Over time
Example:
“Between 2010 and 2020, the population of the city doubled.”
“From 2005 to 2015, the literacy rate in the region increased by nearly 20%.”
“Over the course of five years, smartphone adoption grew steadily.”
Magnitude Adverbs / Adjectives (Degree of Change)
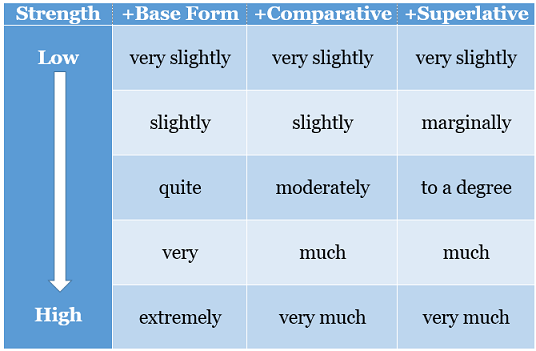
Adverbs:
- sharply
- dramatically
- significantly
- considerably
- rapidly
- markedly
- steeply
- gradually
- steadily
- mildly
- modestly
- moderately
- slightly
- severely
- intensely
Adjectives:
- sharp
- dramatic
- significant
- considerable
- rapid
- steep
- gradual
- steady
- slight
- modest
- minimal
- substantial
- marked
Examples:
“The employment rate increased significantly from 2010 to 2015.”
“Sales dropped dramatically in June but recovered gradually by September.”
“There was a steady decline in user numbers, followed by a sharp rebound at the end of the period.”
Comparison / Contrast Connectors
These connectors highlight contrast and/or similarities:
- while
- whereas
- although
- whereas
- in contrast
- compared to
- compared with
- compared to
- as opposed to
- similarly
- likewise
- whereas
- on the other hand
- in comparison
- whereas
- versus
Examples:
“While exports rose sharply in 2015, domestic demand declined over the same period.”
“Compared to 2018, the figure in 2020 was significantly higher.”
“In contrast to the stable trend for Product A, Product B experienced fluctuations throughout the year.”
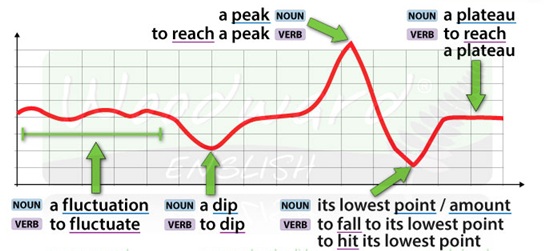
Nouns for Description & Analysis
Use these nouns to make your Line Graph analysis sound more professional:
- trend
- fluctuation
- peak
- trough
- plateau
- dip
- decline
- recovery
- stability
- growth
- increase
- decrease
- variation
- volatility
- magnitude
Examples:
“The overall trend indicates a steady rise in online purchases over the decade.”
“The graph reveals sharp fluctuations in electricity demand during summer months.”
“Smartphone sales reached a peak in 2018 before falling sharply.”
Conclusion
Mastering IELTS line graph vocabulary is a game-changer for Writing Task 1. The ability to accurately describe trends, compare changes, and use varied expressions shows examiners your academic range—and this can be the difference between Band 6.5 and Band 7+.
Visit IELTS Test Pro for expert resources, vocabulary lists, and model answers designed to help you master every part of the IELTS Writing exam. Start building your high-scoring vocabulary today!