IELTS Writing task 1 sample Bar chart – Bài mẫu tham khảo nâng cao band điểm
Trong quá trình ôn tập chuẩn bị luyện thi IELTS Writing, tham khảo bài mẫu các band điểm là cách học rất hiệu quả. Sau khi tham khảo các mẫu bài, người học không những được củng cố kĩ năng sắp xếp thông tin, ý tưởng viết bài mà còn tăng cường vốn từ vựng và học hỏi các cấu trúc câu viết bài hay. Do đó, trong bài viết này IELTS Test Pro cung cấp cho bạn đọc một số IELTS Writing Task 1 sample Bar Chart ở các band điểm khác nhau để các bạn tham khảo luyện thi hiệu quả hơn!

1. IELTS Writing task 1 sample bar chart 01
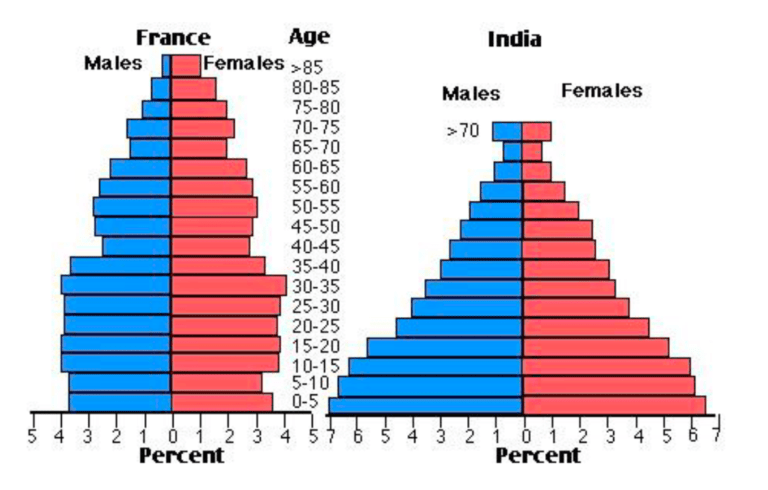
The charts below compare the age structure of the populations of France and India in 1984.
Sample answer
The two charts compare the populations of France and India in terms of age distribution by gender in the year 1984.
The population of India was younger than that of France in 1984, with a noticeably larger proportion of people aged under 20. France, on the other hand, had a significantly larger percentage of elderly inhabitants.
In India, close to 14% of people were aged 5 or under, and each five-year age bracket above this contained an increasingly smaller proportion of the population. France’s population, by contrast, was more evenly distributed across the age ranges, with similar figures (around 7% to 8% of all people) for each five-year cohort between the ages of 0 and 40. Somewhere between 10% and 15% of all French people were aged 70 or older, but the equivalent figure for India was only 2%.
Looking more closely at gender, there was a noticeably higher proportion of French women than men in every cohort from age 50 upwards. For example, almost 3% of French 70- to 75-year-olds were women, while just under 2% were men. No significant gender differences can be seen on the Indian population chart.
Statistics: 199 words | Band: 9.0
2. IELTS Writing task 1 sample bar chart 02
The chart shows the average daily minimum and maximum levels of air pollutants in 4 cities in 2000.
Sample answer
The given bar chart presents the daily minimum and maximum levels of SO2 and N2O which caused pollution in 4 different cities (Los Angeles, Calcutta, Beijing, and Mexico City) in the year 2000. Overall, Mexico City was by far the most contaminated by the two mentioned pollutants among the four cities.
In Los Angeles, the quantity of SO2 emitted into the atmosphere was the lowest of all cities, with a minimum average of 2 micro-grams per m3 and a maximum average of five times as much, at 10 micro-grams. The levels of N2O emissions were much higher with the maximum daily average level reaching up to more than 100 micro-grams per m3. Meanwhile, the atmosphere in Mexico City was severely polluted by SO2 and N2O emissions with the daily minimum and maximum averages of 80 and 113 micro-grams per m3 respectively.
In contrast to Los Angeles and Mexico City, the amount of pollution caused by N2O in Calcutta and Beijing was less than that caused by SO2. The daily average maximum figures for SO2 emissions were 59 micro-grams per m3 in Calcutta and 130 micro-grams per m3 in Beijing while the average maximum figures for N2O were just over 50 micro-grams per m3 in both cities.
Statistics: 200 words | Band: 8.5
3. IELTS Writing task 1 sample bar chart 03
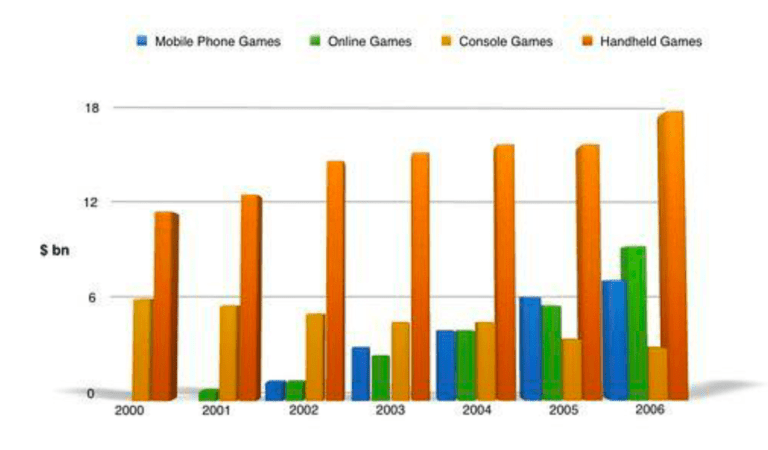
The bar graph shows the global sales (in billions of dollars) of different types of digital games between 2000 and 2006
Sample answer
The bar chart compares the turnover in dollars from sales of video games for four different platforms, namely mobile phones, online, consoles, and handheld devices, from 2000 to 2006. Sales of games for three out of the four platforms rose each year, leading to a significant rise in total global turnover over the 7 years. Sales figures for handheld games were at least twice as high as those for any other platform in almost every year.
In 2000, worldwide sales of handheld games stood at around $11 billion, while console games earned just under $6 billion. No figures were given for mobile or online games in that year. Over the next 3 years, sales of handheld video games rose by about $4 billion, but the figure for consoles decreased by $2 billion. Mobile phones and online games started to become popular, with sales reaching around $3 billion in 2003.
In 2006, sales of handheld, online, and mobile games reached peaks of 17, 9, and 7 billion dollars respectively. By contrast, turnover from console games dropped to its lowest point, at around $2.5 billion.
Statistics: 187 words | Band: 8.5
4. IELTS Writing task 1 sample bar chart 04
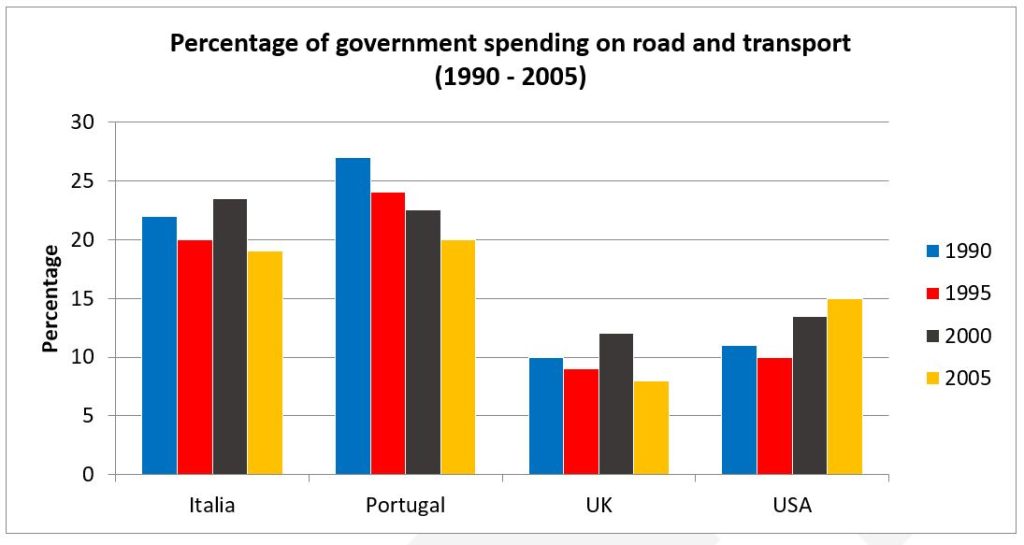
The bar chart below shows the percentage of government spending on roads and transport in 4 countries in the years 1990, 1995, 2000, 2005.
Sample answer
The given bar chart shows the proportion of government expenditure on road and transport in four countries (Italy, Portugal, the UK, USA) every five years between 1990 and 2005.
Overall, it can be seen that governments in mainland Europe spent far more money on roads and transport than those in the UK and USA. It is also clear that the UK spent the least amount of money on roads and transport in all measured years.
In 1990, Portugal spent the most amount of money on roads and transport at approximately 27%, followed by Italy at about 22%, while the USA and UK both spent only around 10% of their government budget. In 1995 however, all countries reduced their road and transport spending by between 1-3%.
By 2000 while Portugal continued to reduce its road and transport spending down to around 22%, Italy had increased its spending to approximately 23%, overtaking Portugal as the leading spender on transport infrastructure in 2000. The UK and USA had both increased spending in 2000 by about 3%. In 2005, all countries except USA further reduced their spending with Portugal, Italy, UK and the USA at 20%, 19%, 8% and 15% respectively.
Statistics: 196 words | Band: 9.0
Để viết một bài writing đạt điểm tối đa, bạn không những cần có từ vựng và ngữ pháp phong phú, đa dạng mà còn phải tuân theo các quy tắc về cấu trúc bài viết. Nếu chưa nắm vững, tham khảo ngay Hướng dẫn viết bài IELTS Writing task 1 bar chart nhé!
5. IELTS Writing task 1 sample bar chart 05
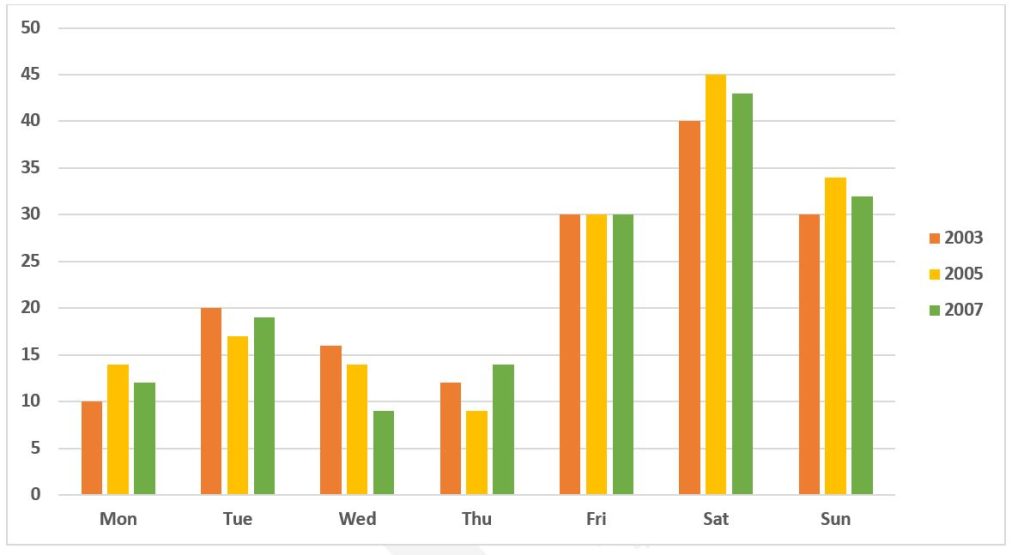
The bar shows the percentage of people going to cinemas in one European country on different days.
Sample answer
The chart illustrates the proportion of people visiting a cinema during seven days of the week in a European nation from 2003 to 2007.
There were only small fluctuations in people’s preference of which day to go to the cinema over the examined period. People in this country tend to go to the cinema on the weekend rather than on Monday to Friday.
In 2003, 40% of people went to cinemas on a Saturday, compared to 30% on Friday or Sunday. On the other days, the proportion of movie-goers was higher on Tuesday, at 20%, while the lowest figure can be seen on Monday, at only 10%.
Over the next four years, the percentage of people going to the cinema on weekends increased slightly to 45% and 35% on Saturday and Sunday respectively. Similarly, Thursday and Monday became more popular among cinema-goers, with about 2% more people choosing these days. However, fewer people went to see movies on Tuesday and Wednesday, with the figures falling to 19% and 9% respectively. Finally, the proportion of movie-goers choosing to go to the cinema on a Friday remained at 30% during the three examined years.
Statistics: 196 words | Band: 8.5
6. IELTS Writing task 1 sample bar chart 06
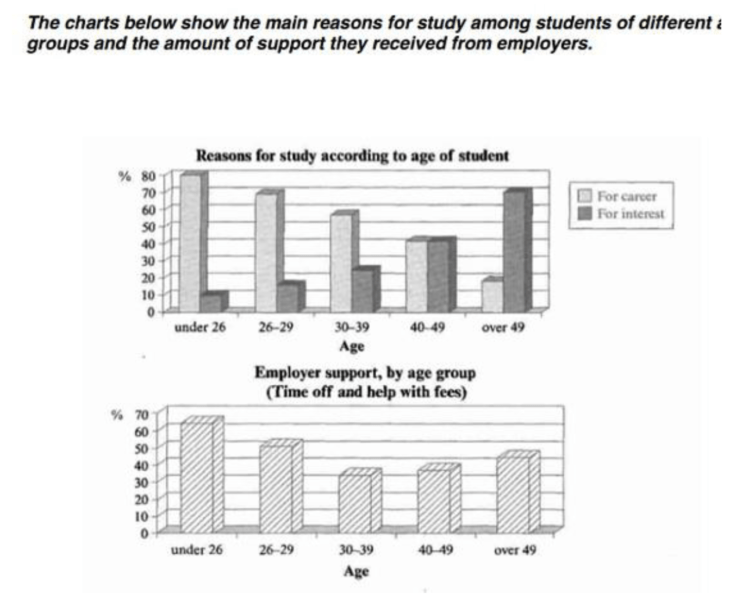
The charts below show the main reasons for study among students of different groups and the amount of support they received from employers.
Sample answer
The bar charts compare students of different ages in terms of why they are studying and whether they are supported by an employer. The proportion of students who study for career purposes is far higher among the younger age groups, while the oldest students are more likely to study for interest. Employer support is more commonly given to younger students.
Around 80% of students aged under 26 study to further their careers, whereas only 10% study purely out of interest. The gap between these two proportions narrows as students get older, and the figures for those in their forties are the same, at about 40%. Students aged over 49 overwhelmingly study for interest (70%) rather than for professional reasons (less than 20%).
Just over 60% of students aged under 26 are supported by their employers. By contrast, the 30-39 age group is the most self-sufficient, with only 30% being given time off and help with fees. The figures rise slightly for students in their forties and for those aged 50 or more.
Statistics: 178 words | Band: 9.0
7. IELTS Writing task 1 sample bar chart 07
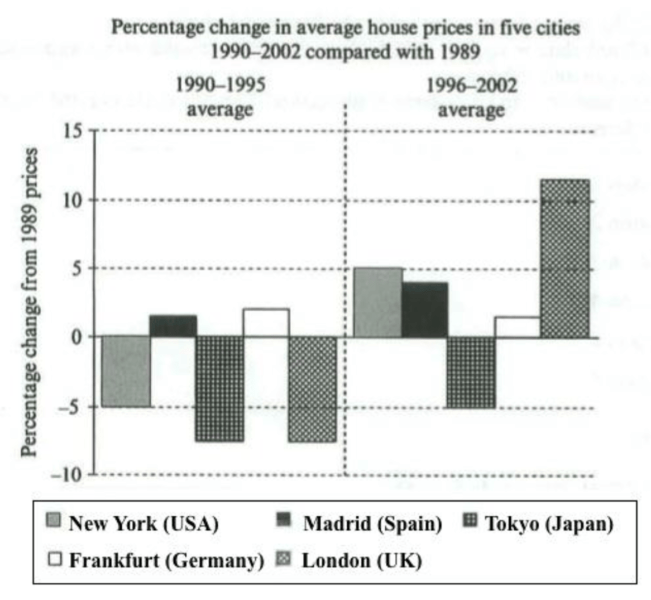
The chart below shows information about changes in average house prices in five different cities between 1990 and 2002 compared with the average house prices in 1989.
Sample answer
The bar chart compares the cost of an average house in five major cities for 13 years from 1989. We can see that house prices fell overall between 1990 and 1995, but most of the cities saw rising prices between 1996 and 2002. London experienced by far the greatest changes in house prices over the 13 years.
Over the 5 years after 1989, the cost of average homes in Tokyo and London dropped by around 7%, while New York house prices went down by 5%. By contrast, prices rose by approximately 2% in both Madrid and Frankfurt.
Between 1996 and 2002, London house prices jumped to around 12% above the 1989 average. Homebuyers in New York also had to pay significantly more, with prices rising to 5% above the 1989 average, but homes in Tokyo remained cheaper than they were in 1989. The cost of an average home in Madrid rose by a further 2%, while prices in Frankfurt remained unchanged.
Statistics: 163 words | Band: 8.5
Trên đây là tổng hợp một số mẫu bài IELTS Writing task 1 Bar chart mà IELTS Test Pro muốn giới thiệu tới bạn. Hi vọng sau khi tham khảo các bài sample trên, bạn học có thể vận dụng vào bài viết của mình để thu được kết quả tốt nhất trong bài thi của mình. Bên cạnh đó, nếu muốn luyện IELTS Writing test online, bắt đầu ngay cùng IELTS Test Pro nhé!